Hello world,
on this blog post, I will try to give you tips on how to debug an AEP Web SDK implementation. AEP Web SDK is definitely the focus of the year when you are working with Adobe Experience Platform (CJA included) and AEP Web SDK is the JavaScript library to actually ingest data from websites (but also applications).
I would encourage you to read the article from Jan Exner on AEP Web SDK so you have a good introduction and I can cut short on that part.
Why a whole article on Q/A?
It seems excessive to have a full article on Q/A of a library but the AEP Web SDK is different from the other libraries you are used to work with.
It is part of such an large solution (AEP) that it is easy to miss to check some part of that solution when you are implementing this library.
As it is explained in Jan article, the AEP Web SDK can do a lot of things, not only the data retrieval part. It sets the ECID, it can deliver the experiences from Target, and even send data to “legacy” solutions such as Adobe Analytics and Audience Manager.
This article will focus mostly on the data send to AEP because this is the future and the usage of AEP Web SDK for legacy solution is, in my opinion, only a temporary solution before you move to AEP “Application Services” (Customer Journey Analytics instead of Adobe Analytics, AEP Activation instead of Audience Manager, etc…)
AEP Web SDK Architecture
The biggest difference and difficulty when working with the Adobe Web SDK is that it has a layer before reaching the (Adobe Experience ) platform and you need to send the data following a specific schema that is unique for your dataset.
Contrary to the normal javascript library (AppMeasurement), you do not have direct relationship with the application you are using (AEP in our case vs Analytics), the middle layer and the schema validation process prevent us from this direct relationship with it. Therefore, when there are some errors, you may not see them directly in the request.
You are POSTing data with a body. It works or doesn’t work but that can happen later down the road (of data ingestion).
To give you a better understanding on how the AEP web SDK works with the Adobe (Experience Platform) ecosystem, I prepared an oversimplified schema representation of the data flows / architecture.
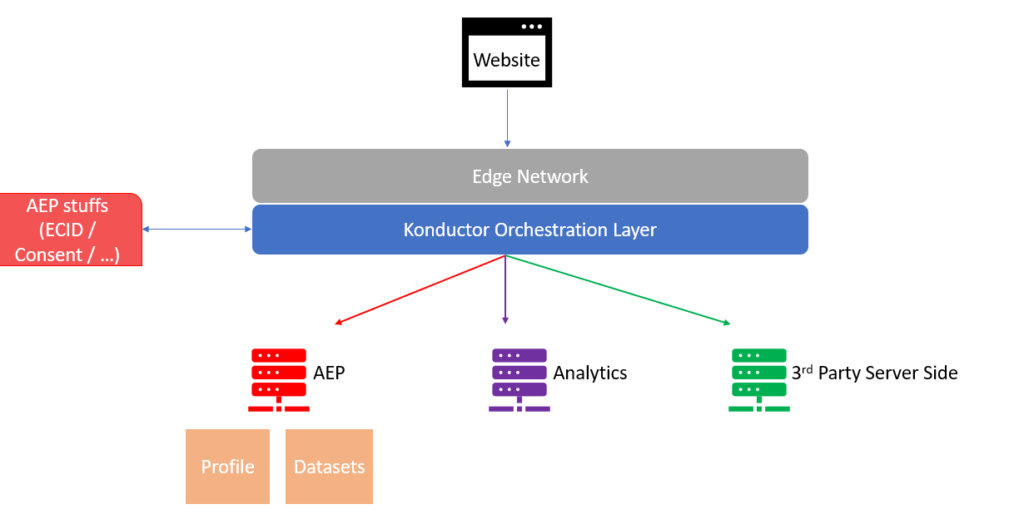
In that example, I took only Analytics and 3rd party Server Side application as generic examples but there can be much more that Konductor can interact with.
I also added the Profile and Datasets in AEP because they do not live in the same “database”. More precisely, one information is stored more on a data lake type of storage as the other is populating a more “graph database” that will be used for the different AEP services (see article on Identity Service).
You can also see that it takes care of ECID generation and other services directly from the middle layer. It will also takes care of consuming our personalization endpoint to render experiences and much more. The very interesting part is that the whole infrastructure is built on the Edge.
What is the Edge ?
Basically, you can consider it a CDN on steroid. At least I consider it as much. It offers the capability of CDN location-wise (low latency) but also provide some processing capabilies to apply functions on your data. You could imagine that the Edge will be able to apply machine learning model algorithm hosted in Platform in your data. You push your data via AEP Web SDK and the calculation with all parameters apply on a low latency server and is being returned.
The previous “legacy” scripts where very well separated, Visitor Service for ECID in Analytics, Audience Manager Module for AAM with Analytics, or DIL code for just Audience Manager. mbox or target.js for Target, etc…
There was a direct relationship of one script = one application. So it was easier to debug.
Setup for QA
There are some easy things that will facilitate your life a lot when working with the Adobe Web SDK.
I will list these things below and explain how they can help out:
Adobe Experience Platform Debugger Extension
In case you didn’t know yet, Adobe release a new extension in order to debug the requests sent to your Experience Platform instance. (Yes the previous extension was still in Beta…)
You can find the Platform Debugger extension here (Chrome, Firefox) and I would highly recommend to install it as soon as you are using Platform.
It encapsualte lots of nice feature:
- Enabling debug mode: View logs in console.log about what happened in the request.
- Override the configuration ID: The AEP Web SDK requires a configuration ID to tell the Konductor what to do with the data.
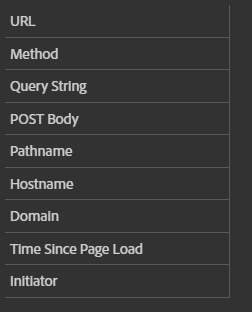
You can test different configId directly from the webpage (if schema used are the same). - Seeing the requests in a nice format.:
Saying that this extension is awesome and 100% complete is probably too much. Because AEP is evolving so much and AEP Web SDK with it, the extension is bound to be developed even further.
Hopefully this will improve its usability as reading the POST body may not be that easy or other elements are not always captured if it is sent just before a document.unload event.
Understanding AEP Web SDK config
This is related to the documentation on the web SDK documentation presented on the Adobe website. You can find it here.
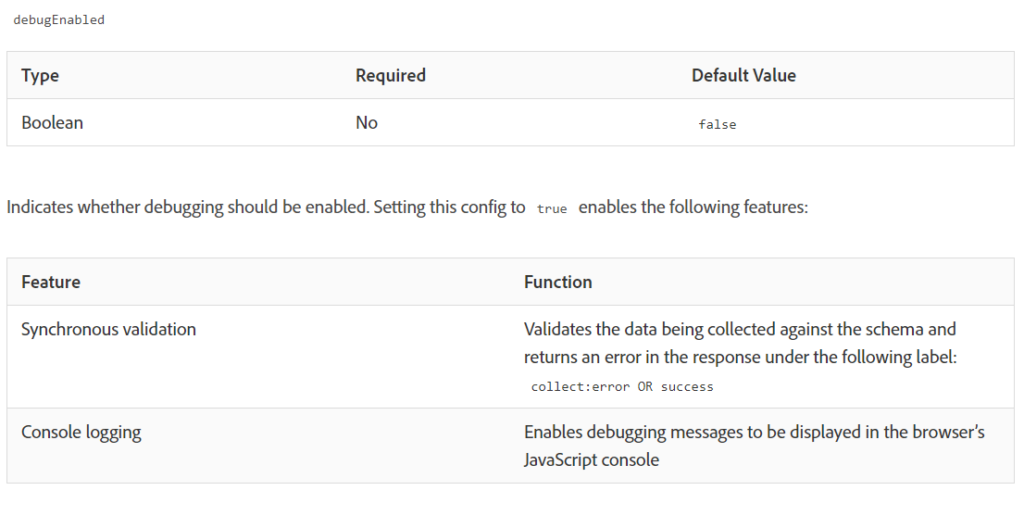
The configuration is important, because as I stated previously you can do a lot of things with this library.
One important element for the Q/A is the debug mode that I presented above, this ability can be enabled directly through the JS implementation. It enables the synchronous validation and the console logging.
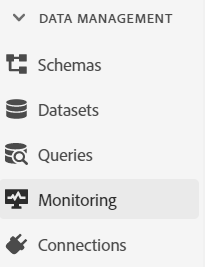
Open the Monitoring page in AEP
The monitoring pages in AEP is very important when you want check the correct ingestion of the data into AEP. You can currently find it in the Data Management section
You will find 2 possible monitoring elements when you click on that:
Either Batch monitoring or Streaming monitoring.
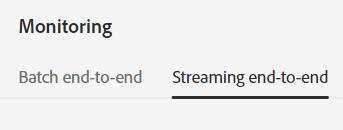
As you can imagine, the AEP Web SDK is categorized as Streaming option and we will need to select this one.
One element to focus on is the dataset name. There you can identify more easily your batch arriving.
What about batch ? I thought it was streaming !
Yes, it is the streaming option but the Konductor is taking care of gathering multiple elements so it can realize batch ingestion, which are easier o ingest in large quantity. It is faster to count element 10 by 10 than 1 by 1. So we do batch, but micro-batch.
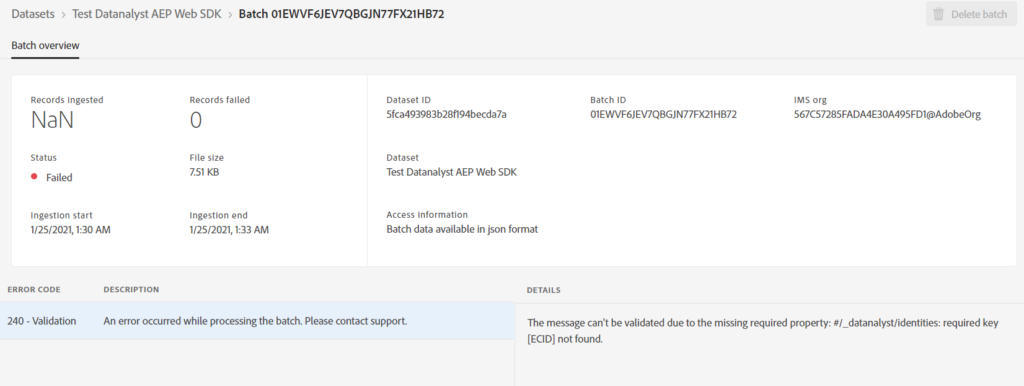
You will be able to monitor the ingestion of the batch, like how many records, if it was ingested in the profile (requires you to enable your dataset and schema to unified profile – see identity article again)

The important part is that you can click on the Batch ID when the ingestion fails and see the error that caused that error.
Summary on AEP Web SDK QA
As explained previously, this is not straightforward to implement and see if data are ingested anymore. It requires you to look on the client side through the console log and the debug option, but also to have a look on the back-end data ingestion, within the Adobe Experience Platform interface.
The main reason is that the AEP Web SDK needs to be flexible enough so anyone can use it with their own schema, each schema being unique the complexity lies on your side.
In the old world, for the person using Adobe Analytics library, we only had one schema with limited possibility (s.propX and s.eVarX mostly). Therefore you rarely had issue with schema composition and debugging back-end ingestion. After 6 months working on it, you knew most of the possible schema paths.
You could change company and in matter of weeks understand the implementation logic.
Let say that now for us, consultants, with AEP web SDK and Schema the job get (a lot) tougher. You need to understand the business model, the type data layer and the schema/data model used to start to understand client implementation.
Even thought, you may start to miss these days (not gone yet 😉 ), there were use-cases similar regarding some schema issues but they were not explicit. Remember when you tried to ingest merchandising events and do not set them in the s.events beforehands. In that case, there was no error in your code, everything was set but the schema composition was wrong and data were not ingested.
Going Further on Q/A
Many of you would not be satisfied with the Q/A process I presented above. You are checking data ingestion but you are not checking the data itself.
It is really up to the responsibility you have decided, some are only taking care of data ingestion, some only data quality, some are taking care of both.
In case you want to check the data quality, then you would need to use the Query Service option to check the data received in the dataset directly.
For that, you use the interactive query option in the UI… or the Interactive Query module with the python module aepp. (a bit of self promotion here)
The Query Service usage is an article on itself. Actually it is probably more than one article, but I already started and Frederic Werner as well, so go check this article where I reference a possible usage of it based on Frederic Werner article.
What I can show you in this blog post is to adapt your query to AEP Web SDK and especially on your test.
The thing with AEP Web SDK is that it generates its ECID automatically and store it in an Identity Map dimension. That is a bit complicated element in a schema that is hidden from common users but enables the Adobe Experience Platform to resolve the identity graph more or less automatically.
Therefore, once you know your dataset and the ecid that has been assigned to your visitor during the test, you can directly request all of the events captured in the dataset.
Accessing your ECID
In the AEP Web SDK, most, if not all, elements are promises. This ensures correct sequences on your library execution, but it can be difficult to access some data for people not familiar with promises.
There is an explanation of this in the official documentation. However, it doesn’t provide a full example of the code to run, just the pseudo promise code.
Here is the more concrete code to retrieve your ECID:
let ecidalloy("getIdentity").then(function(result) { // The command succeeded.ecid = result.identity.ECID;}).catch(function(error) { // The command failed.console.log("error"); // will be an error object with additional information.});
Now you have your ecid in the “ecid” variable and you can copy it to whichever application or script you want to.
It is important to know that, at the moment (2021) Launch data elements don’t support the promises so you cannot use that to populate a data element returning the value. What you can do, is to set another data element via a rule (rules in Launch support a promises). You can set a data element via the _satellite.setVar() method. The variable will only be available on that page but that is usually enough if you set your rule to run first and on every page.
The next step is to go to the Query Service and retrieve all of your data for that ECID in the correct dataset.
You can access the ECID that have been created automatically in the IdentityMap by running this query statement (I owe that to someone way smarter than me for this):
Select identityMap['ECID'][0].id as ECID from tableName.
Obviously, you will not run only to return this element from the table but with the correct condition, then you can match the ECID that you have run your test with.
This will ease your debugging to actually see the actions you have realized and if they have been ingested correctly.
Now, you have all the information possible to successfully QA your Web SDK implementation. Have fun and don’t hesitate to comment if I have a big miss or I am not clear on a part.