Analyzing cross products in Adobe Analytics was easy with the Reports & Analytics interface.In Reports & Analytics, there is the report Cross-Sell that you can find in the product tab.
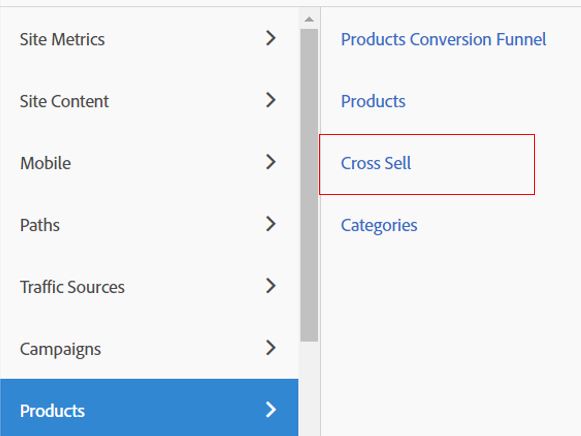
But where did it go in Workspace ?
In Workspace, it is nowhere to be found and this was a very helpful report to look at when you are a retailer.
As we know that Reports & Analytics is not going to be there for long, I will show you how to implement it on your own for Adobe Analytics workspace.
Implementation of the Cross Sell report in Workspace
When I say “in Workspace”, it is a bit of lie. The reality is that we are going to implement it in the JavaScript code that is running, and then it will be available in the report.
The main problem about the Product dimension in Adobe Workspace (and any of its classification) is that if your user is buying multiple products at the same time (in the same request) it is pretty hard to analyze what has been bought with it.
One of the option could be to create a segment to make this analysis (segments in Adobe Analytics can answer almost all the questions) but it is not so dynamic. You need to create a particular HIT segment for each cross sell product you want to analyze.
What I really wanted to do was to have a report available to manually drag and drop a second dimension that dynamically gives you all of the other products bought for a specific product. No segment(s) needed.
A bit of JavaScript & products understanding
With every good story of twisting Adobe Analytics, or almost every good stories, we have to modify the JavaScript code tracking.
Before we are doing the modification, let’s explain a bit why it is not working by default in Adobe Analytics to see which products has been bought with a specific product.
So when the user is doing a purchase 2 specific things are being sent to Adobe Analytics :
- the s.products variable :
If there is more than 1 product in the basket, it will look something like this :
s.products=”;pid1;1;10;;,;pid2;2;14;;,;pid3;2;20;;” - the s.events dimension with the “purchase” event.
those 2 information are the one that are going to populate your products reports.
How does that work ? You need to see the “products” variable as a listprop dimension. At the end, it last only 1 hit and it only work with specific events, “purchase” being one of them (full list here). When “purchase” is being sent, the “products” variable is expecting some value to be received.
The “products” variable, by default, will always be unpacked with the comma (“,”) delimiter.
for example, when there is a cart view (another event that can be associated with the product dimension).
| raw value | product id unpacked | event associated |
|---|---|---|
| “;pid1,;pid2,;pid3” | pid1 | cart view |
| “;pid1,;pid2,;pid3” | pid2 | cart view |
| “;pid1,;pid2,;pid3” | pid3 | cart view |
when there is the purchase, the information will look like this :
| raw value | product id unpacked | event associated | revenue | units |
|---|---|---|---|---|
| ;pid1;1;10;;,;pid2;2;14;;,;pid3;2;20;; | pid1 | purchase | 10 | 1 |
| ;pid1;1;10;;,;pid2;2;14;;,;pid3;2;20;; | pid2 | purchase | 14 | 2 |
| ;pid1;1;10;;,;pid2;2;14;;,;pid3;2;20;; | pid3 | purchase | 20 | 2 |
As you can see, the revenue and units are calculated directly out of the product string.
So the “product”, “revenue” and “units” are just classification of a listprop with numerical classification.
— before 2018, it was possible to do numeric classification yourself in Adobe, not possible anymore (I am very sad about that).
If you follow and understand the theory you know what you have to do for having a cross sell dimension.
You just copy the correct product value into your listprop and you will have a dimension that automatically breakdown any product value and will return you which one has been purchased at the same time.
It will most likely look like this : s.propx = “pid1,pid2,pid3”
One important information : The breakdown will automatically give you a a copy of the product value that has been purchased.
So the first line of the breakdown will always be the product that you breakdown on. As the prop is the copy of the products, of course, the product will be always in the copy dimension. So you have to ignore the first line of the breakdown.
How to use the cross sell information ?
Cross Sell information are very useful for numerous reports and strategies :
- You are able to see the best combination of product with your high-performing sellers.
- More importantly, you will be able to see if there is any push that can be done to the low performing sellers by having a nice bundle created.
- Having classification to your products will lead you to see which category and also working together. Anyone has heard about personalization ? Imagine you can find which products are the most suited to your customers based on what the have bought BUT also from what other users have bought with this product. It doesn’t have to happen to this particular users, but if it is the majority of them, you may want to personalize their website experience based on that.
- You can add more information to your prop and see if any push is actually influencing a specific category or a product.
- ANY dimension that you can drill up to the product (so merchandising evar) are available to your cross sell analysis.
You wanted to know the type of product bought when this particular product was added to basket with a Promotion ? Is it different than when there is no promotion. If you have low & high margin products that are highly correlated to your main product (the one you are doing the analysis for), it may worth looking into.
Some people are going to say that this is mostly copying a basic Business Analysis that can be run with your Order Data base. It is true, and I hope every company that has Adobe Analytics is able to pull this kind of analysis with the Business Analyst department. However Adobe Analytics cross sell analysis enable EVERY user to be able to run this analysis. Not only the analyst that can cross reference Data Table together with the right JOIN. It is, with Adobe Analytics just a drag and drop analysis that every user can do, being tech savvy… or not.
I hope this trick on Adobe Analytics will help you to go forward on your analytics journey.
As always, don’t hesitate to comment or contact me if you want to have deeper explanation on this.