This article is to explain mostly the second type of performance analysis I have performed recently. It is a follow up from this article.
This article covers mostly the analysis of HAR files and what type of KPI you can retrieve from them.
What are HAR files ?
Following the W3C github post, HAR stands for HTTP Archive Format. It is a JSON-formatted archive file format for logging of a web browser’s interaction with a site. The common extension for these files is .har.
This seems interesting but what does that actually covers ?
It covers quite a long sort of metrics and information and this format is still going under some work. So it can evolves in future and my list will not be exhaustive and/or covering information that have been deprecated from HAR files.
Global objects:
- creator : information about the application that have created this HAR file
- browser : contains information about the browser that created the log
- log : This is the most interesting element as it contains information about :
- entries : an entry is a request that has been fired by the page
- pages : which page is being requested
You may be thinking this now : “This starts to look like very interesting information now! Why did you bother using your stup*d performance crawler on the first place ? I wasted 10 mn of my life reading that article!”
OK this is fair enough… the problem with HAR file retrieval, it is that it is not as easy as the information we retrieve with the performance.getEntries() javascript console.
How to retrieve the HAR file analysis
You can read this good article from box.com about HAR generation.
If you would like to generate the same kind of information by using a crawler, you would need to use a man-in-the-middle technique to generate those files.
That would not been a huge deal in 2015-2016, but now that all website are using HTTPS, you would need to generate a certificate for your browser so your man in the middle is authorize to catch and decipher those information.
As you can imagine now, it is not that straight forward to realize this in an automated manner.
Not impossible though, but if I manage to realize (which is my plan), just using the module I would have created will require some configuration that are not beginner-friendly for other users.
Let’s postpone this module creation and use the good old hand retrieval within a browser. 😉
Entries object
What I was explaining a bit before, it is that the Entries array that are nested within the log object are really interested for us in order to realize performance review.
The most interesting information available from the entries object are the following (full list here) :
- startedDateTime :
Date and time stamp of the request start (ISO 8601 – YYYY-MM-DDThh:mm:ss.sTZD) - time : Total elapsed time of the request in milliseconds. This is the sum of all timings available in the timings object (i.e. not including -1 values)
- timings (object)
- blocked : Time spent in a queue waiting for a network connection. Use -1 if the timing does not apply to the current request.
- dns : DNS resolution time. The time required to resolve a host name. Use -1 if the timing does not apply to the current request.
- connect : Time required to create TCP connection. Use -1 if the timing does not apply to the current request.
- send : Time required to send HTTP request to the server.
- wait : Waiting for a response from the server.
- receive : Time required to read entire response from the server (or cache).
- ssl : Time required for SSL/TLS negotiation. If this field is defined then the time is also included in the connect field (to ensure backward compatibility with HAR 1.1). Use -1 if the timing does not apply to the current request.
- request (object)
- method : Request method (GET, POST, …).
- url : Absolute URL of the request (fragments are not included).
- cookies : List of cookie objects.
- queryString : list of query strings
- postData : data info contains in the post
- headersSize :
Total number of bytes from the start of the HTTP request message until (and including) the double CRLF before the body. Set to -1 if the info is not available. - bodySize :
Size of the request body (POST data payload) in bytes. Set to -1 if the info is not available.
- response (object)
- status : 200 / 404 / 302/ …
- cookies : List of cookie objects
- headersSize :
Total number of bytes from the start of the HTTP response message until (and including) the double CRLF before the body. Set to -1 if the info is not available. - bodySize :
Size of the received response body in bytes. Set to zero in case of responses coming from the cache (304). Set to -1 if the info is not available.
- cache (object) : information about the cache. I would recommend to disable cache when you retrieve the elements as you want to know all the elements that are requested on the page. You can optimize cache later on.
You will tell me that is a lot of information to digest and you will be right because this is for only one page. Imagine that you have to analyze this for tens or hundreds of pages…
For professional, there are tools that helps you analyze those files and aggregates those data in a simplify manners.
In our case, there are 2 main problems :
- We don’t have access to those tools
- We are not professionals 🙂
The 2nd comment is half a joke as we are professionals but we don’t know a lot about those HAR files (we don’t use them every day, neither every week) and my philosophy is when you want to understand something, you need to get to understand as much raw information as you can. Doing that it will help you understand later on what the tool is actually doing for you.
(This comments is valuable for any subject you want to master – sometimes you don’t need to master it, then shortcuts are useful)
Analysis shortcuts (Harpy module)
As explained a bit before, there are a lot of data and I will take a bit of a shortcut here in order to shorten this article.
After discovering the data using jupyter notebook, I created a new module for my analysis. The idea is pretty simple, you run the module within the folder where all of your HAR file are located and it generates a “.csv file” with some data aggregated. Mostly data related to performance.
This new module is available on my github account and its name is “harpy“. Yes, like the mythological creature, but also because it is a HAR python analyzer. Got it now 😉
It is in my other scripts folder : https://github.com/pitchmuc/other_scripts
I will most likely do a blog post about it that will explain the methods.
HAR Data analysis
So you have run the harpy module in your folder and it has created a “.csv” file.
Let’s look what is inside and how to interpret the data.
import pandas as pd
df = pd.read_csv('summary_blog.csv',delimiter='\t')
df.head()
this should give you something like this :
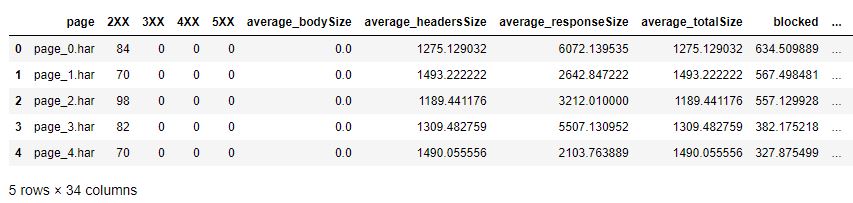
looking at the column, we have an extensive list here.
The harpy module I created is trying to gather as much data as possible in this dataframe.
df.columns
OUT:
Index(['page', '2XX', '3XX', '4XX', '5XX', 'average_bodySize',       'average_headersSize', 'average_responseSize', 'average_totalSize',       'blocked', 'connect', 'cookies', 'dns', 'missing_blocked',       'missing_bodySize', 'missing_connect', 'missing_dns',       'missing_headersSize', 'missing_receive', 'missing_responseSize',       'missing_send', 'missing_ssl', 'missing_wait', 'nb_cookies',       'nb_entries', 'receive', 'send', 'ssl', 'total_bodySize',       'total_headersSize', 'total_responseSize', 'total_size', 'total_time',       'wait'],dtype='object')
If you are familiar with the web connection vocabulary, you should not be lost here.
Here we can start by using the the overview data from Pandas.
df.describe()
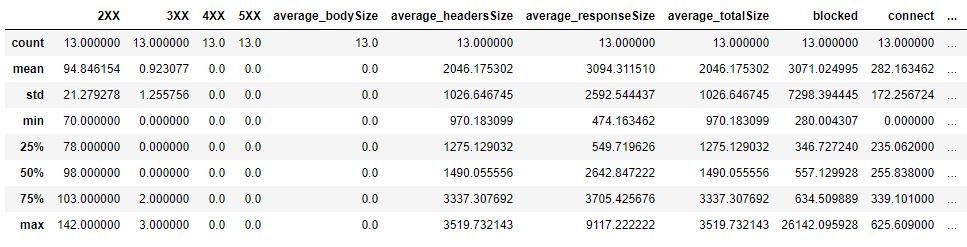
This method is quite important when you are working on large data set and you want to have a glance on what is going on here.
As you can see, we quickly identify that there is no bodySize from the request that we sent. Most of the information are being sent by the Header. The average responseSize is 3094 bytes but the standard deviation is 2592.
This means that there is a high variance on the responseSize per request.
This is confirm by the minimum and 3rd quartile values (474 and 3705).
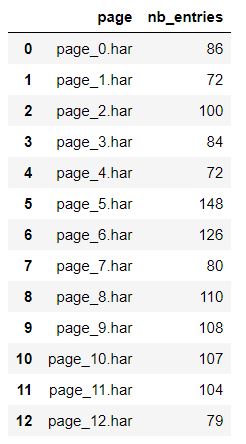
The data will give you the number of request that are being sent by each page, you just have to look at the column “nb_entries”
df[['page','nb_entries']]
Adding more column to visually see if there is a correlation.
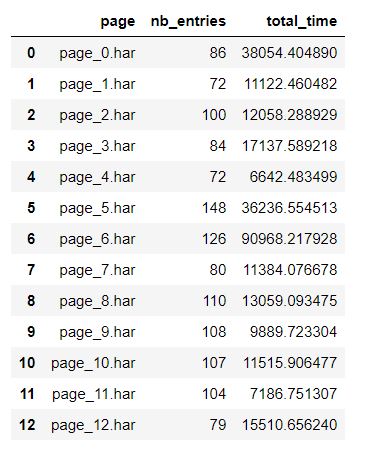
df[[‘page’,’nb_entries’,’total_time’]]
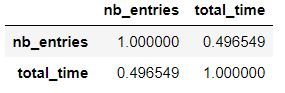
You can also directly ask for correlation status on your 2 columns :
df[['nb_entries','total_time']].corr()
In order to have some view on the distribution of a serie, you can use the boxplot as well.
df['receive'].plot(kind='box')
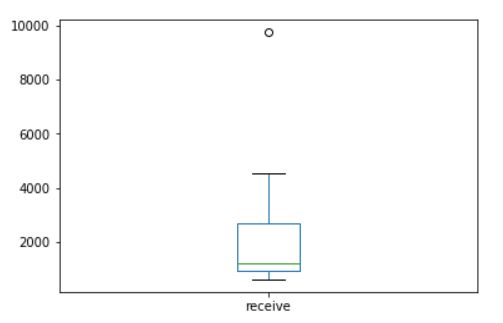
Let’s see what is this extreme point on the box graph.
df[df['receive'] == df['receive'].max()] ## This returns you the specific row for this.

I hope this article shows you a bit of what you can do in analyzing the performance of your pages.
As you could have noticed, the data are not the same than the one we retrieve when we are using the crawler I described on my first blog post on performance analysis.
So both approach could be complementary if you need further data to confirm your hypothesis.