Hello guys,
On this series of articles I would like to present you the different things I have done in order to analyse performance on your pages.
Especially regarding tags and analytics implementation but this could be applied to any type of resources.
A good understanding of what is the DOM would be required to continue the reading.
Using Implementation Checker
For those of you that follow my blog for a little longer, you may have known that I developed a python scraper that enable you to gather the different dimension and events that have been set on the page. You can find the 2 articles I wrote here : Why and what is the scraper & How to use the Implementation Checker
I am doubtful that a lot of people have read these articles, therefore I would re-explain them briefly.
The scraping tool is actually using selenium to render the Javascript and retrieve the resource that send the Adobe Analytics request.
This works well with GET request but the POST request send the information within their payload and therefore, we have to render each variable to catch them.
The most important part for the coming analysis is that I found a way to retrieve the resources used by using the performance JS library :
performance.getEntries()
This methods returns you the different elements that have been requested by the page in order to render the information.
This is what we are going to use for the performance analysis of our page.
Performance library in JavaScript
As explained above the performance.getEntries() library is returning you all the resources that are used on your page. This is returning you a list of resources.
Global page resource
However the first resource that is requested is always going to be the global page resource and this resource is a bit special.
Each resource have common attributes attached to them and we will see them later, but this global page resource has specific attributes.
Those specific attributes are :
- domComplete: This is when the DOM has been loaded
- domContentLoadedEventEnd: When the DOM starts to be loaded
- domContentLoadedEventStart: When the DOM has finished to be loaded
- domInteractive: This is when the page starts to be interactive, so it is close to what the user feels.
The DOM may not have been finished to load but user can interact.
- loadEventStart: This is when your page finally start to render everything by applying upper (JS) layer. It returns zero when the load event has not been not fired.
- loadEventEnd: When everything is complete, this event is being fired on the resource.
To understand the complete picture of how the page is loaded, take a look at this picture that I took from the W3C website.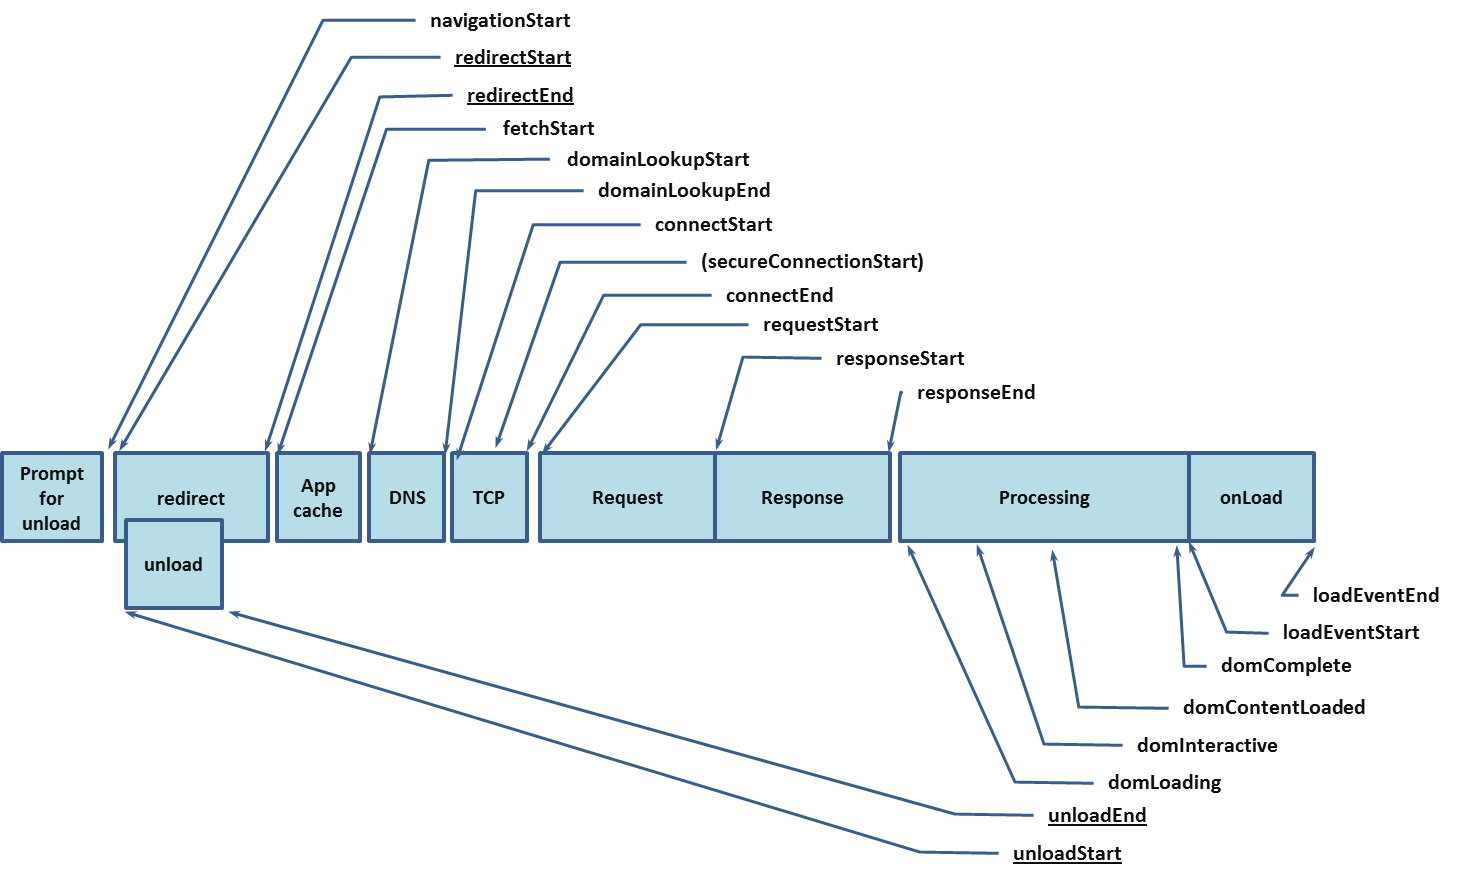
I would focus briefly on 2 points here :
- The page doesn’t have to have the DOM completed in order for the user to interact with it
- The onLoad event is very badly named here, as it is actually the last element to load. Correct naming should have been “finishLoad” or something else. 🙂
Other resources attributes
The other resources (and the global page resource) have other attributes you can fetch. You can see the list of resources on the W3C website but I would point some interesting attributes :
- requestStart: When does the request start to be fetched
- responseEnd: When does the request is finished being loaded
- responseStart: When the response from the resources starts
- startTime: when does the process of the resource starts
- duration: duration in millisecondes for how long it takes
- encodedBodySize: how much there is to download
- entryType: Can have those different values
- resource
- frame, navigation
- mark
- measure
- paint
Performance analysis
If you didn’t drop from the previous paragraphs of explanation, you may are wondering what we are going to do with all of these things.
As I said, I took at the beginning the implementationChecker script and I modified it. I fetch all of the resources available on the page and being loaded by a Tag Manager (Adobe DTM in that case) and also the global page resource.
When we are done with retrieving that information, we will start the analysis with python in order to render some insights.
As I did for the implementation checker, I share my performance analyzer on GitHub at that address : https://github.com/pitchmuc/adobeanalytics_impementationchecker
You can check the code and you will see that this python file will retrieve those information :
- Requests sent by the assets.adobe… (DTM or Launch request)
- Request sent by Adobe Analytics
- Request send by the global page request
Those information will be exported in 2 variables by the function perfchecker().
Arguments of perfchecker:
- url : REQUIRED : can be an url or a list of url – if it is list the counter will be set automatically to the number of url you have passed
- counter : OPTIONAL : number of url to retrieved (default to 10)
- noCache : OPTIONAL : is the cache will be disable or not (default to False)
- mobile : OPTIONAL : if you want to test for mobile website (default to False)
- verbose : OPTIONAL : if you want comments (default to False)
This will return 2 dataframes :
- Data from the requests
- Data from the global page performance
Why did I return 2 and not 1 ? Because as explained above, they are not returning the same number of attributes. The global page performance will return specific DOM performance attributes.
An example of using the python script (once it has been loaded) :
df_requests, df_dom = perfchecker('http://www.datanalyst.info',counter=10,noCache=True)
I would set noCache to True in order to have the maximum load time for your pages. This load time would be for anyone entering your webiste for the first time for each page.
In reality, thanks to the cache possibility, there are not really a lot of loadtime from one page to another.
Analyzing the requests’ performances
When we have both dataframe on our machine, we can start to analyze them in order to identify if there is a big gap between the global page performance and the different requests asked.
First, we will need to take the common key to merge them. The common key is the URL that are actually the same for retrieving the request performances and the global page performances.
If df_requests represents the dataframe of your request and df_dom the dataframe of your global page performance.
df = pd.merge(df_requests,df_dom,left_on='url',right_on='url')
When you have this data, you can start by looking differences between script request and page performance (such as DOMinteractive).
df['time_diff'] = df['analytics_responseEnd'] - df['domInteractive'] ##Here analytics_responseEnd is the when the responseEnd event is being reached from loading the adobe analytics script.
A simple :
df['time_diff'].mean()
will give you the average difference between the time it takes for the analytics script to load and the moment the users can actually start to navigate on the website.
This information is quite interesting because if the difference is important, it means that the user may be able to navigate on your website without firing the analytics tag. “What is a good time?” you will ask me (because there will be a difference), from experience, it should be as close as possible to the second (from the DOM interactive event), even less if possible. More and it can really starts to have an impact on your tracking.
When you have all the information about the script, you can average also their starting point and the average of the domComplete event.
This is more tricky that you would think because each URL has one global page performance tag, but it can have multiple tags within the same URL, and not always the same.
So my strategy was to do it with 2 different dataframe :
- one dataframe to take all the global page performance
- one dateframe to group the average script performance for each script type
Global page performance
This one is fairly easy :
df['DOMcomplete'].mean()
Grouping different script performances and taking there average
On this one, I actually already gave you a tip which is “grouping“.
df.groupby(['script'])['fetchStart'].mean()
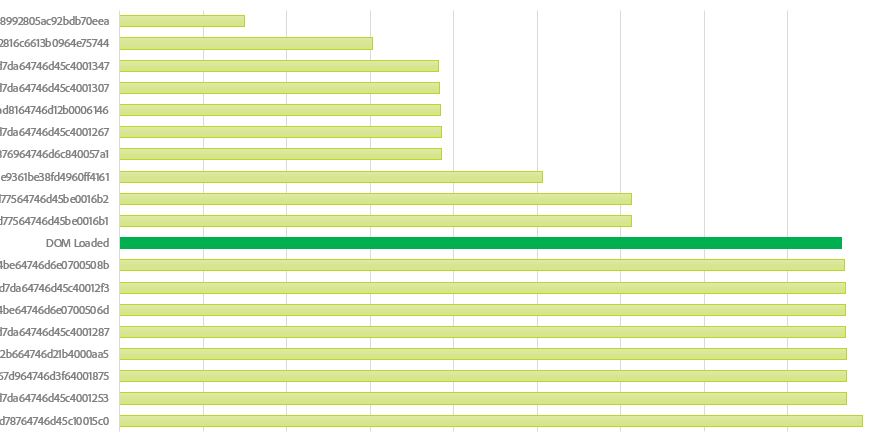
we can then append the DOM complete data to the script grouping data frame and it will enable you to have new view on which script is actually impacting the load time.
Because each script that is being called before the DOM complete event is actually taking time upon this completion. When the scripts are called after this event is being generated by the page, it doesn’t really impact the user on the page load, so it is less dramatic.
I have 8 scripts that may have an impact on the load time of the page and the DOM complete events, therefore directly impacting the performance of the page.
But having a script loading before may not have such an impact, and it may be required to load that tag.
Fortunately, from the information we have retrieved by the performanceChecker crawler, we were able to look at script weight and script duration and have a clear view if these are correlated or not.
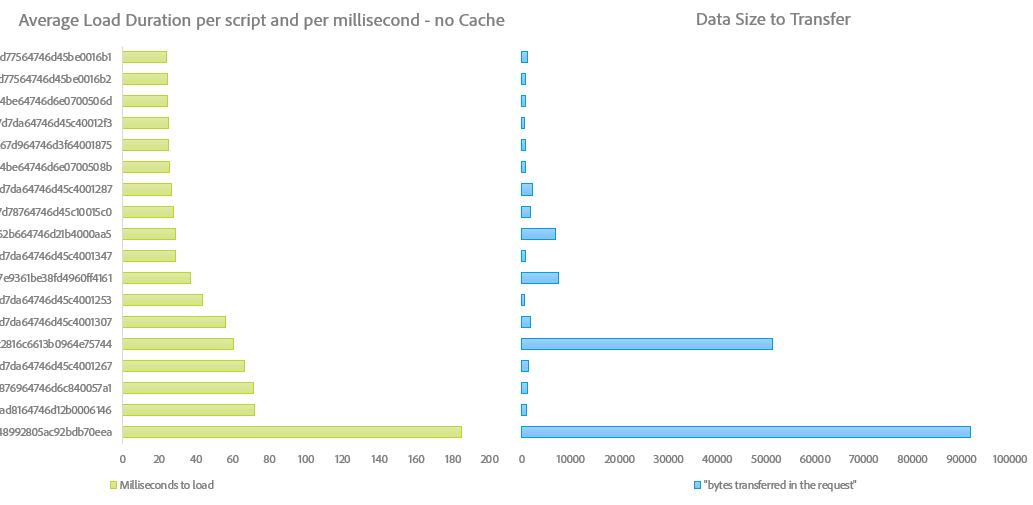
This where you need to know which script is which and therefore try to optimize their load or their execution.
Some scripts are fairly low on size but takes a long time to load. Those are problematic scripts that you want to make (as much as possible) load at the end of the page load.
In a more classical way, you can take the time of each page URL to load all of the script and compare them with the current URL loading time. Building this kind of graph would help you to understand if there is an URL that stands out of your website performance and should be more focus in you analysis.
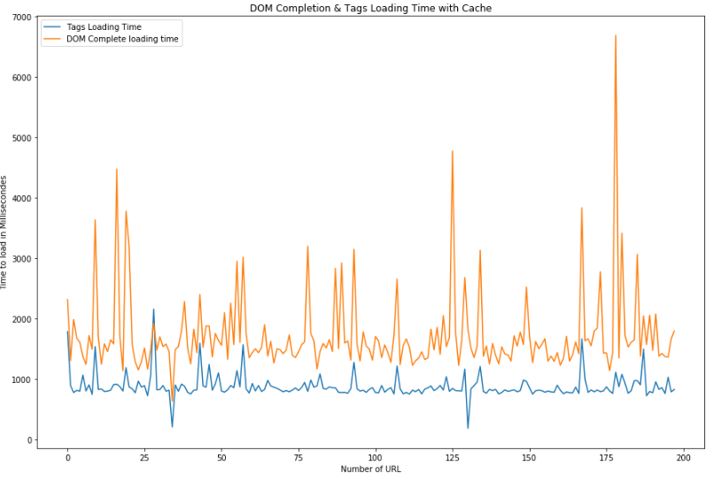
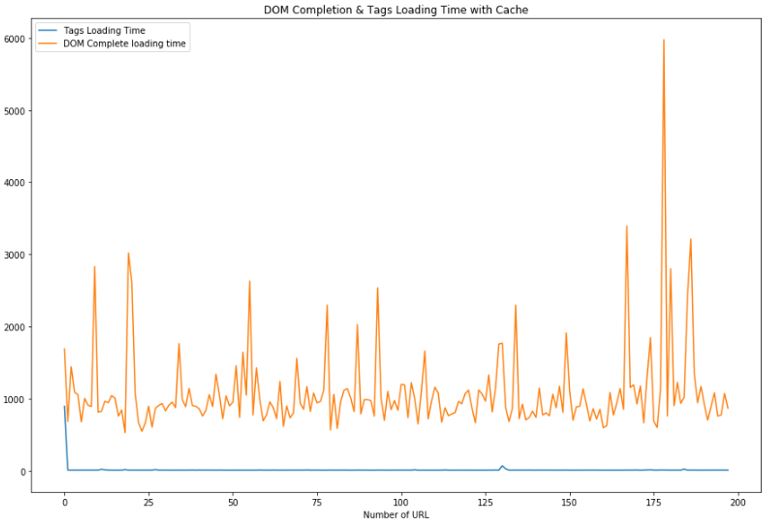
As explained before, those data have been retrieved without enabling the cache so we can see page performance for each of them. If we would have the cache enable we would be more realistic view on a user journey through your website, but it doesn’t really gives you the performance analysis of your website, and for each of your website.
You can find the real user journey on performance for your website when cache is enabled below (if your website has cache-control enabled).
Even less instructive, you should always remind yourself of that case in order to not be over dramatic about your tag performances.
On those nice graphs, I will close this post and hope I gave you some clues when you want to analyze the performance of your website, especially regarding loading the tags and how you can analyze these information with python.
Some of you may think that this crawler is quite useful and will really help to focus on a specific topic for your analysis but you may want to have a more global view of your page performances and not only focusing on a specific set of tags.
In order to do this kind of analysis, we will cover that with a second blog post and analyze HAR files for your website.
See you soon.