2018 was an extremely good year for Adobe Analytics Workspace. We got some very useful features such as attribution IQ, segment comparison, drop-down filters and tons of quality-of-life improvements for visualizations. One thing that a lot of people seem to have missed though, is a project concept presented in one of the “tips and tricks” -posts. The original idea can be found here in tip number seven, but as it took me a long time to even find this page again, and as there seems to be no other blog posts about this simple yet brilliant idea, I thought I would share with you my view regarding the usefulness of having a table of contents project.
In a nutshell, a table of contents project is a directory of all of your master templates – i.e. projects that act as a readily set-up framework for your Adobe Analytics end-users. A quick glance to the example project already shows how effective it can be:
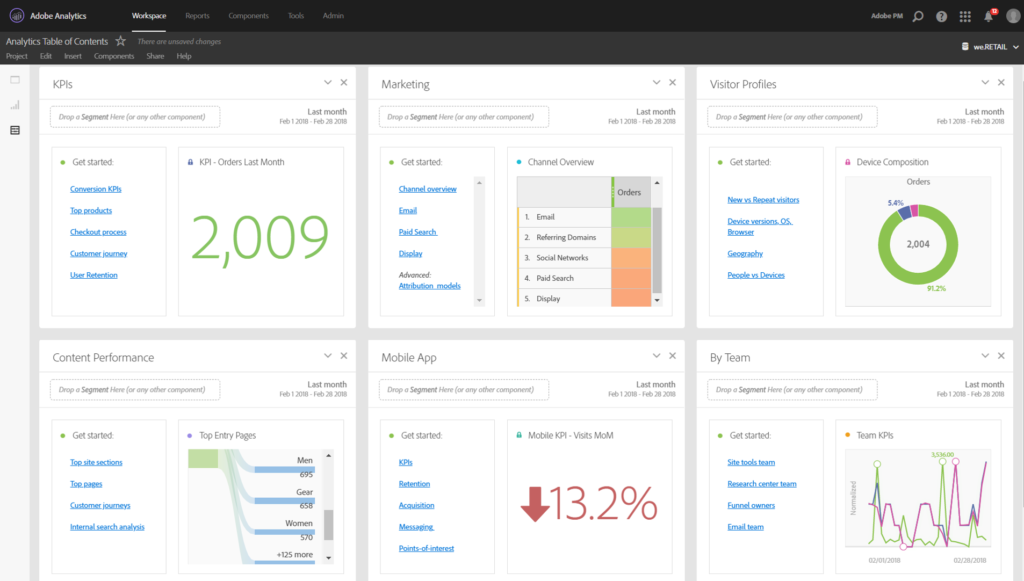
As you can see, having a table of contents works compliments Adobe Analytics Workspace on many levels, which we’ll review more in depth below.
The anatomy of a table of contents project
The basic concept of a table of contents project is pretty simple. It works as a map which helps the analytics users to navigate to the correct project, and at the same time give them an idea of what kind of data you have available in your web analytics setup. Grouping projects to distinct categories like digital marketing, mobile app, content management etc. does not only help people to find the right template, but also to give a broader view of what Adobe Analytics has to offer for their organization.
At the same time the table of contents acts as a showcase of all your important workspace components, such as your main dimensions, metrics and segments. Even better, you can give a bit of a teaser regarding the fancy visualization capabilities that the workspace offers, and quite often even these example graphs and plots will give instant insights for the new Adobe Analytics users. For me, the biggest benefit is to help new users make their first strides in the workspace environment, and to get an easy overview of what is available there.
Giving an overview of the web analytics landscape
Web analytics is a function which has several touch-points and stakeholders within companies. These stakeholders may often be in silos, meaning that they are unaware what the other functions are doing, and what kind of data they might be using – if any. With the the table of contents, the web analytics team is able to showcase all the different themes and departments that have dedicated master templates created for them, and give a better overall understanding of the traffic and conversion data within the company.
If you are not familiar with the concept of a master template, it is basically a workspace project that is built in a way that the end-users can dive straight in the data with only doing very minor modifications – e.g. selecting a segment from a drop-down filter on top of the project. In our company we accompany these templates with links to our internal wiki documentation, which offers very in-depth guidance on how to use the template, read the figures, make insights out of the data, and most importantly – how to turn these insights into actions. The master templates are of course offered via the new project selection as well, but the table of contents project grouping and example visualizations help to set the context.
In conclusion
By now, you are hopefully convinced that the table of contents project for Adobe Analytics Workspace can be a very beneficial for your web analytics setup. It takes some time and effort to maintain of course, but it is the best place to present your work for the rest of the company, and show what kind of topics you are working on.
In our team we modify the table of contents on a regular basis based on the feedback we get from the users. We include master template titles that are not even finished yet, and encourage everyone to give us ideas on what topics to tackle next. We also try to include new visualizations in the panels, so that people would get inspired to use them in their custom projects in the future.
Hopefully this quick article has been helpful to you. We would love to hear your feedback, especially if you have already done something similar at your workplace and to share some tips with us and the other readers.